- Keneitsino Lydia
- March 7, 2026
Challenging 30 Concentration vs Time Graph MCQs Chemistry for Competitive Exams – Powerful Practice Guide
Understanding graphical interpretation is one of the most powerful tools in chemical kinetics. Among the most tested areas in exams is the concept of concentration vs time graph mcqs chemistry. When aspirants prepare for board exams or competitive entrances, they frequently encounter concentration vs time graph mcqs chemistry because graphs provide a direct visual representation of reaction order and rate behavior.
In chemical kinetics, a concentration vs time graph mcqs chemistry discussion generally begins with zero order reactions. For a zero order reaction, the concentration of reactant decreases linearly with time. This means that when we plot concentration against time, we obtain a straight line with a negative slope equal to the rate constant. Many concentration vs time graph mcqs chemistry problems test whether aspirants can recognize this linear behavior and connect it to zero order kinetics.
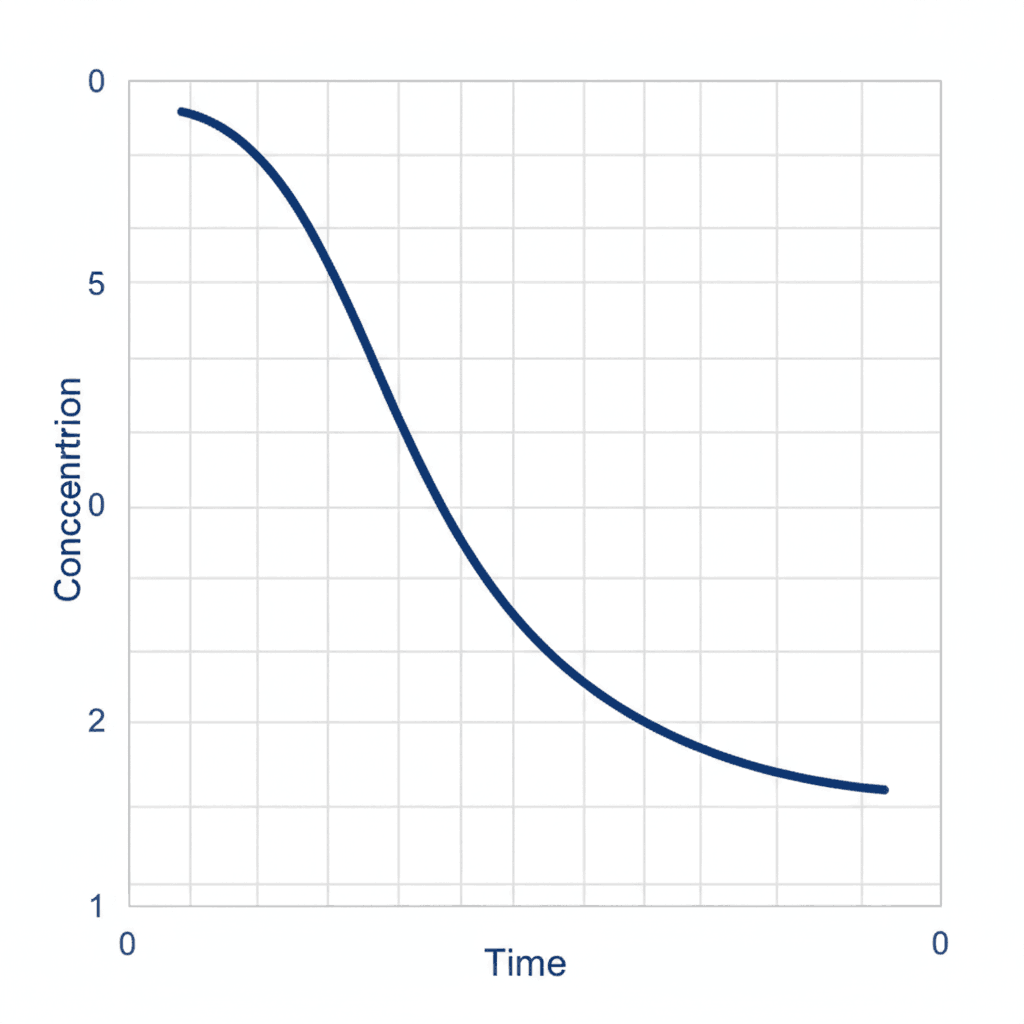
For first order reactions, the situation is different. The concentration vs time graph mcqs chemistry concept explains that the concentration decreases exponentially rather than linearly. The graph of concentration versus time is a curve that gradually flattens as time increases. In concentration vs time graph mcqs chemistry, aspirants are often asked to identify that although the concentration vs time curve is not linear, the logarithmic form such as log concentration versus time gives a straight line.
Second order reactions show yet another pattern. In concentration vs time graph mcqs chemistry discussions, it is emphasized that the concentration decreases more sharply at the beginning and then slows down significantly. The curve is steeper compared to first order reactions at higher concentrations. In concentration vs time graph mcqs chemistry, recognizing these curvature differences becomes essential to determine reaction order visually.
Half-life behavior is another key concept associated with concentration vs time graph mcqs chemistry. For first order reactions, equal time intervals reduce the concentration by half repeatedly. This characteristic exponential decay is visible in concentration vs time graph mcqs chemistry representations. For zero order reactions, however, half-life depends directly on the initial concentration, which changes the slope but maintains linearity.
In concentration vs time graph mcqs chemistry, graphical slope interpretation plays a vital role. The slope of a concentration versus time graph for zero order reactions is constant and equals −k. For first order reactions, the slope continuously changes because the rate depends on concentration. Understanding this slope behavior helps solve concentration vs time graph mcqs chemistry conceptual questions without lengthy calculations.
Temperature effects also influence concentration vs time graph mcqs chemistry interpretations. When temperature increases, the rate constant increases, leading to a steeper decline in concentration. In concentration vs time graph mcqs chemistry, this is reflected as a sharper curve or steeper line depending on reaction order.
Another frequently tested idea in concentration vs time graph mcqs chemistry is identifying reaction completion. Zero order reactions reach zero concentration in a finite time, which appears as the line touching the time axis. First order reactions, however, approach zero asymptotically and never truly reach zero concentration. Many concentration vs time graph mcqs chemistry questions are designed around this subtle graphical distinction.
Practical laboratory experiments also rely heavily on concentration vs time graph mcqs chemistry principles. By plotting experimental concentration data against time, chemists determine reaction order visually before applying mathematical analysis. Thus, mastering concentration vs time graph mcqs chemistry strengthens both theoretical understanding and experimental interpretation skills.
Concentration vs Time Graph MCQs Chemistry:
Q1. Which concentration plot is linear for a first order reaction?
A. [A] versus time
B. ln [A] versus time
C. log [A] versus 1/time
D. √[A] versus time
Answer: B
2. Concentration Change in First Order Reaction
A. Linearly
B. Exponentially
C. No change
D. None
Answer: B
3. 12.5% Remaining in 1 hr
A. 3 hr
B. 20 min
C. 30 min
D. 15 min
Answer: B
4. Half-Life Calculation
A. 2 × 10¹⁰ s
B. 2 × 10⁴ s
C. 3 × 10¹⁰ s
D. 2 × 10⁸ s
Answer: C
5. Order from Data (Halving Each Hour)
A. Zero
B. One
C. Two
D. Three
Answer: B
6. Molecularity and Order
A. 2 and 2
B. 2 and 1.33
C. 2 and 1
D. 1 and 2
Answer: A
7. Time Calculation
A. 30 min
B. 15 min
C. 7.5 min
D. 60 min
Answer: A
8. H₂ + I₂ Reaction
A. Single step
B. Second order overall
C. k decreases with T
D. Activation energy lowers
Answer: B
9. Order of Reaction
A. 1
B. 2
C. 3
D. 4
Answer: C
10. Dissociation of HI
A. Zero
B. 1
C. 2
D. 3
Answer: C
11. Ratio (99.9% / Half-Life)
A. 12
B. 4
C. 8
D. 10
Answer: D
12. Volume Reduced to Half
A. One-fourth
B. One-eighth
C. Eight times
D. Four times
Answer: C
13. Order When Rate Doubles
A. Two
B. One
C. Zero
D. Half
Answer: D
14. Photochemical Reaction Order
A. Zero
B. First
C. Second
D. Third
Answer: A
15. Plot of log(a−x) vs t
A. Straight positive slope
B. Straight negative slope
C. Through origin
D. Curve
Answer: B
16. Second Order Reaction
A. 2NO + O₂ → 2NO₂
B. HI dissociation on gold
C. H₂O₂ dissociation
D. K₂S₂O₈ + 2KI → 2K₂SO₄ + I₂
Answer: D
17. 20% Conversion Formula
A. t=2.3035log10020t = \frac{2.303}{5} \log \frac{100}{20}
B. t=2.30320log100kt = \frac{2.303}{20} \log \frac{100}{k}
C. t=2.303klog54t = \frac{2.303}{k} \log \frac{5}{4}
D. t=2.303100logk80t = \frac{2.303}{100} \log \frac{k}{80}
Answer: C
18. First Order, Volume Reduced to 1/3
A. 1/3 times
B. 2/3 times
C. 3 times
D. 6 times
Answer: C
19. Order from Half-Life Data
A. Zero
B. 2
C. 1
D. 4
Answer: B
20. Ester Neutralization
A. V∞=VtV_\infty = V_t
B. V∞=Vt−V0V_\infty = V_t – V_0
C. V∞=2Vt−V0V_\infty = 2V_t – V_0
D. V∞=2Vt+V0V_\infty = 2V_t + V_0
Answer: C
21. log C vs t Straight Line
A. Zero order
B. First order
C. Second order
D. Third order
Answer: B
22. Order of N₂O₅ Decomposition
A. 3
B. 2
C. 1
D. Zero
Answer: C
23. Correct Plot for First Order
A. Option 1
B. Option 2
C. Option 3
D. Option 4
Answer: C
24. Ratio (75% / 25%)
A. 3
B. 2.303
C. 4.8
D. 0.47
Answer: C
25. CH₃COOC₂H₅ + NaOH
A. Order 2, molecularity 1
B. Order 1, molecularity 2
C. Order 1, molecularity 1
D. Order 2, molecularity 2
Answer: D
26. Time Calculation
A. 10
B. 12
C. 30
D. 3
Answer: C
27. Pseudo First Order Reaction
A. Alkali hydrolysis
B. Acid hydrolysis of sucrose
C. PCl₅ decomposition
D. HI dissociation
Answer: B
28. 100% Completion (Zero Order)
A. a/k
B. a/2k
C. 2a/k
D. k/a
Answer: A
29. NH₃ Decomposition Order
A. Zero
B. 1
C. 2
D. 3
Answer: A
30. Overall Order (aP + bQ)
A. 1
B. 2
C. 3
D. 2.5
Answer: C
Conclusion on Concentration vs Time Graph MCQs Chemistry
In summary, concentration vs time graph mcqs chemistry is not just about recognizing shapes of curves. It involves connecting graphical behavior with rate laws, order of reaction, slope interpretation, half-life properties, and temperature dependence. When aspirants develop strong command over concentration vs time graph mcqs chemistry, they gain the ability to solve kinetics problems quickly and confidently in examinations.